SOCIAL MEDIA

WITH LUNEER MGMT

Instagram profile page of Shannon Smith, a real estate agent, showing posts, highlights, and profile information.
@realtorshan

FEED EXAMPLES

Screenshot of Instagram profile of Jordana Botting with profile picture of a boat on water, 134 posts, 578 followers, and 202 following. Feed includes images of a waterfall, scallops, a woman outdoors, a woman on a plane, a pool deck, the Gateway Arch, a historic mansion, vineyards, and a cathedral.
@jordanabotting
Instagram profile of Luneer Mgmt, a virtual assistant team. Profile displays 64 posts, 353 followers, and following 254 accounts. Bio describes helping CEOs organize and grow, with a note about limited posting frequency, and mentions 2 July HoneyBook spots left. Profile highlights include testimonials, highlights, meet the team, pets of Luneer, and HoneyBook. The grid shows various posts including a testimonial, a photo of a cat with a caption, a motivational quote about self-care, business graphics, and a woman working on a laptop.
@luneermgmt
Instagram profile page of @wholebeing_energy, a performance and leadership coach. The profile features a logo with the text 'WHOLEBEING ENERGY,' a bio, follower and post counts, and various posts about energy frameworks, leadership, nature, coaching, and motivational quotes.
@wholebeing_energy
Instagram profile page for Pedego Winnetka, a veteran-owned electric bike store in Winnetka, Illinois, showing profile picture, post thumbnails, and followers count.
@pedegowinnetka

ANALYTICS

Social media insights report showing increases in accounts reached, engaged, and followers for May 1 to May 31.
A line graph showing Facebook page reach comparison between two date ranges: May 11 to June 7 in light blue, and April 13 to May 10 in gray. The reach increases over time for both periods, with the May-June period reaching 2.7K, slightly higher than the April-May period.
Social media analytics over the last 30 days from May 9 to June 7 showing increased account reach and engagement, and total followers.
Social media analytics dashboard displaying account growth statistics from March 10 to June 7, including accounts reached, engaged, and followers with percentage increases.
Line graph showing Instagram reach data from June 4 to June 8, 2023, with a peak on June 6 and an overall increase of 26.8% over the previous week.

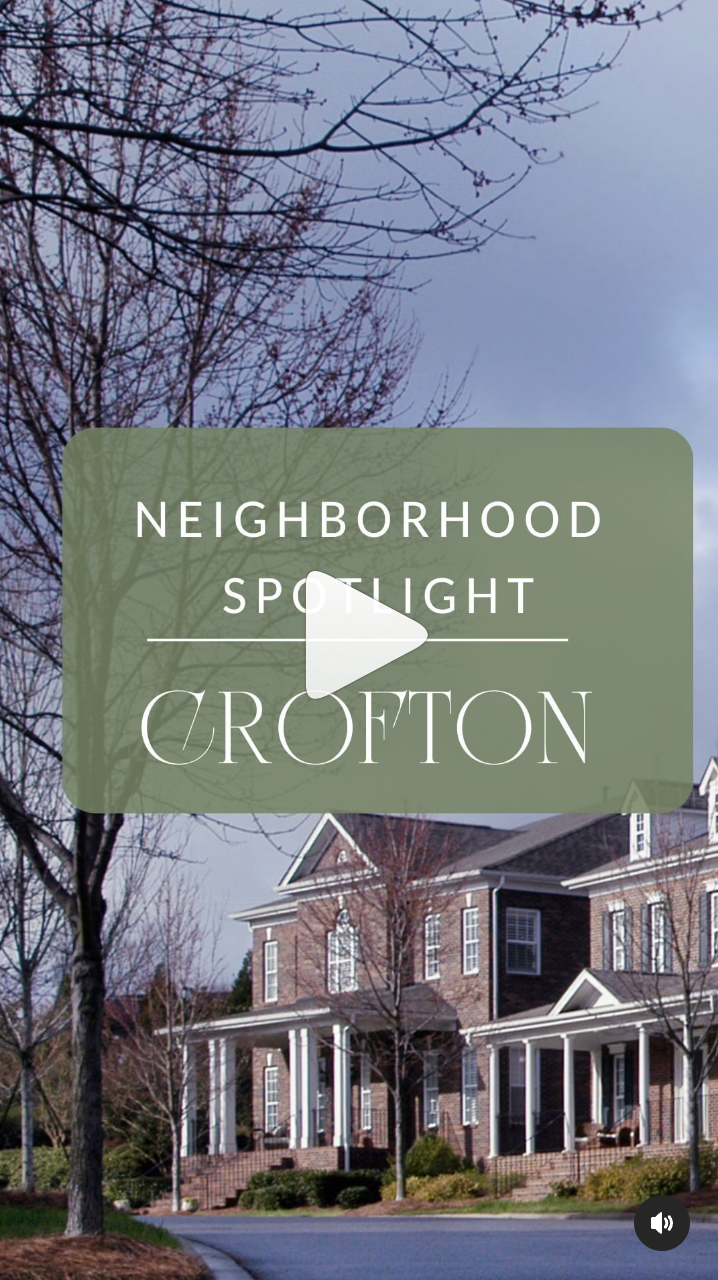
SHANNON SMITH - REELS

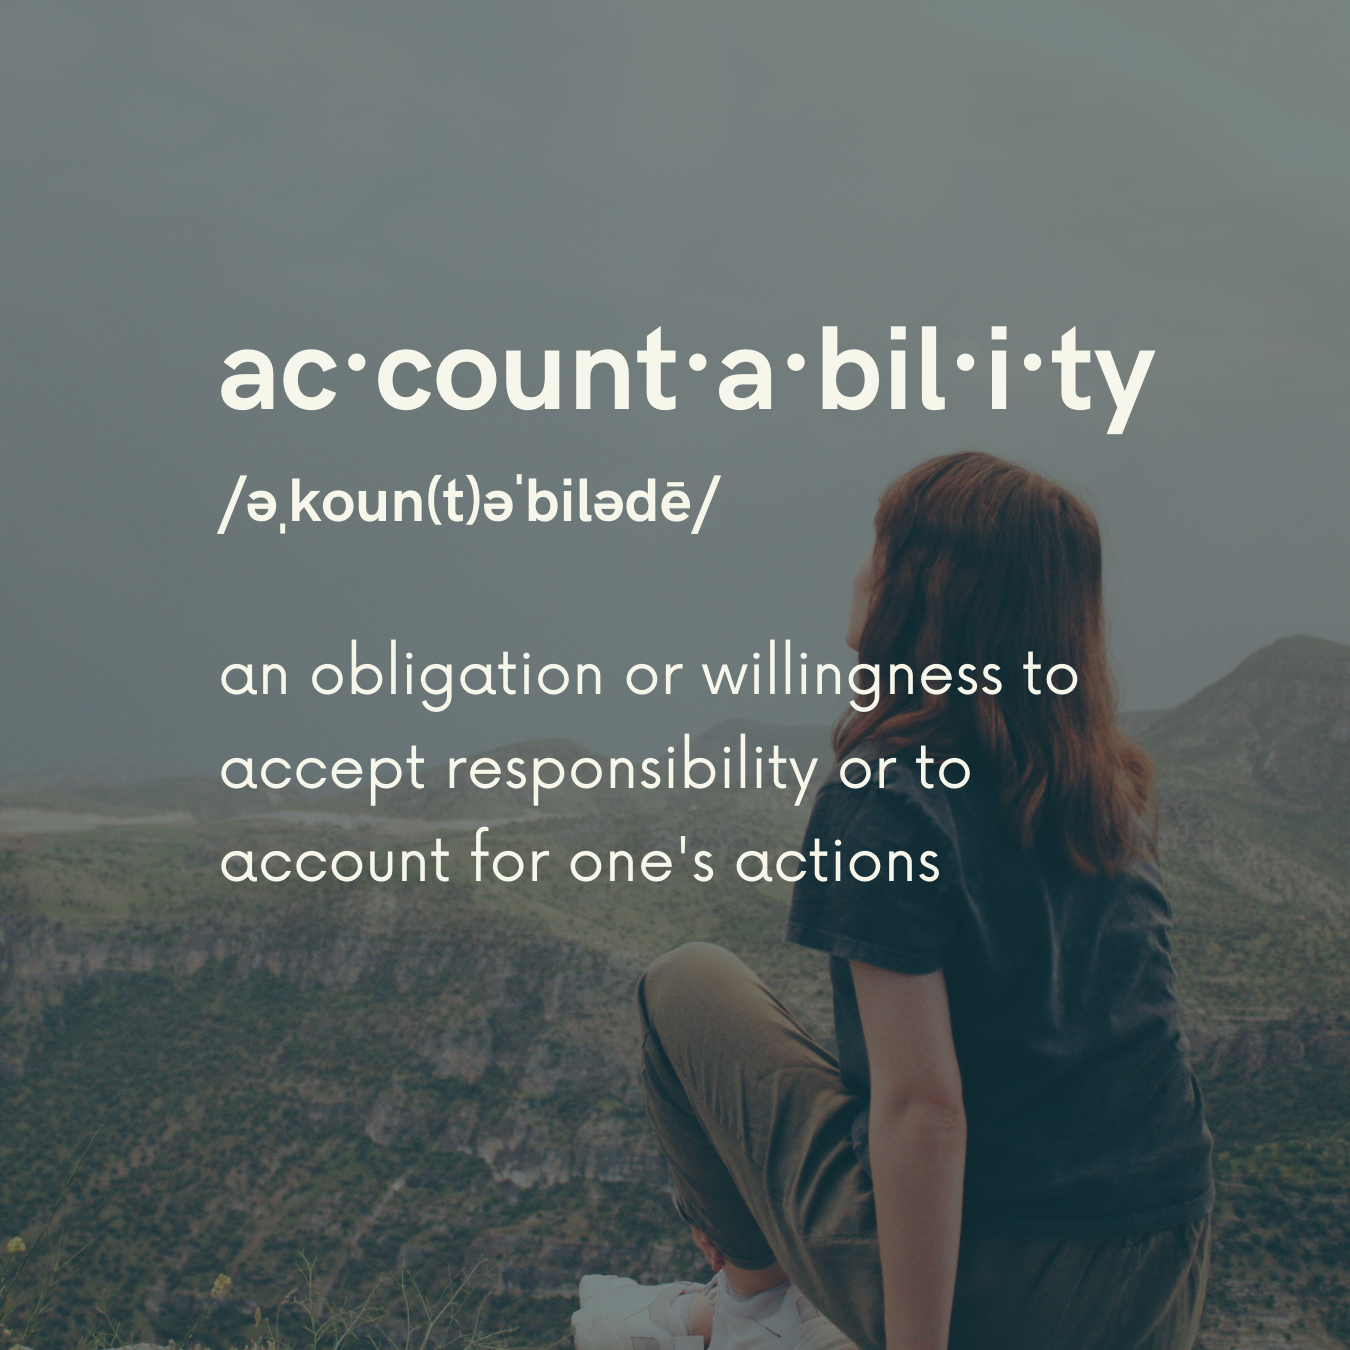
JORDANA BOTTING - Graphics

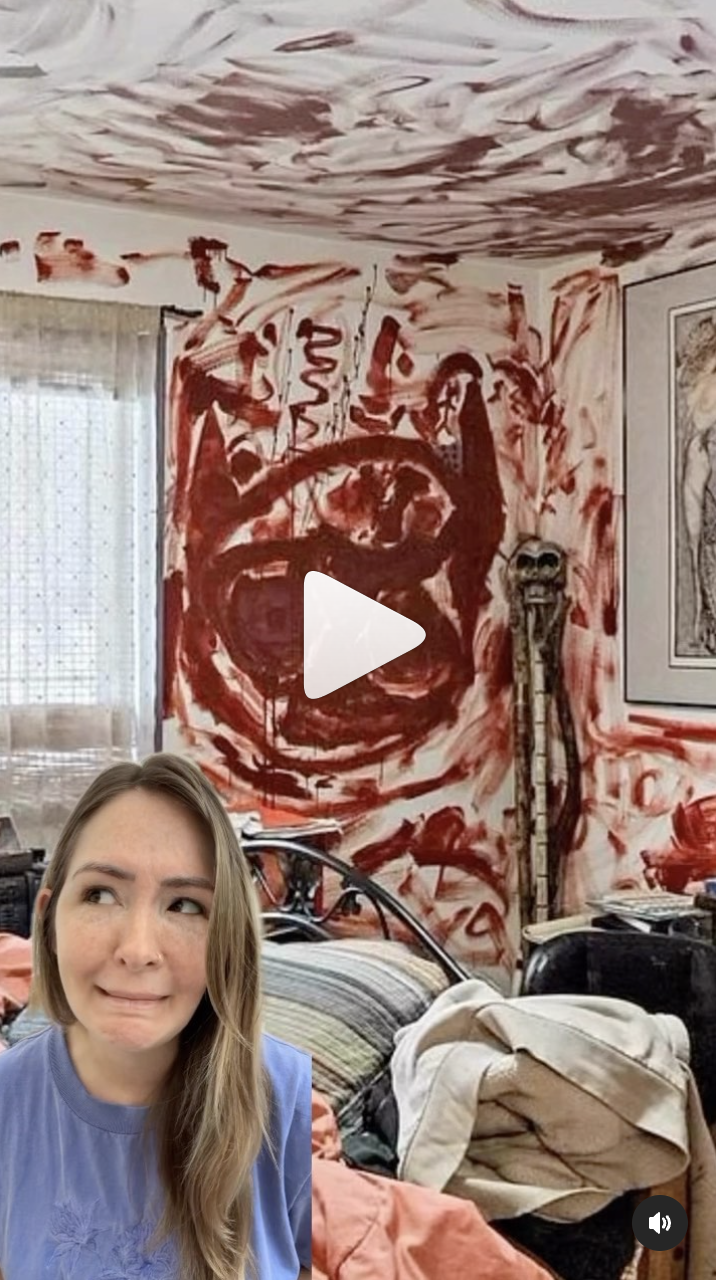
Jordana Botting - REELS

WHOLEBEING ENERGY - GRAPHICS

Wholebeing Energy - Reels